In this article, I’ll share with you how to use VSCode and XDebug to start debugging your Drupal project.

This explanation assumes you are using Lando for local development and you have XDebug installed inside the Lando container.
For more information about Lando please check:
VSCode setup
First, you need to create a launch.json file in your workspace with the following code:
{
  // Use IntelliSense to learn about possible attributes.
  // Hover to view descriptions of existing attributes.
  // For more information, visit: https://go.microsoft.com/fwlink/?linkid=830387
  "version": "0.2.0",
  "configurations": [
    {
      "name": "Listen for Xdebug",
      "type": "php",
      "request": "launch",
      "port": 9003,
      "pathMappings": {
        "/app/": "${workspaceFolder}/"
      }
    }
  ]
}
The path to the launch.json should be: [PROJECT_ROOT]/.vscode/launch.json
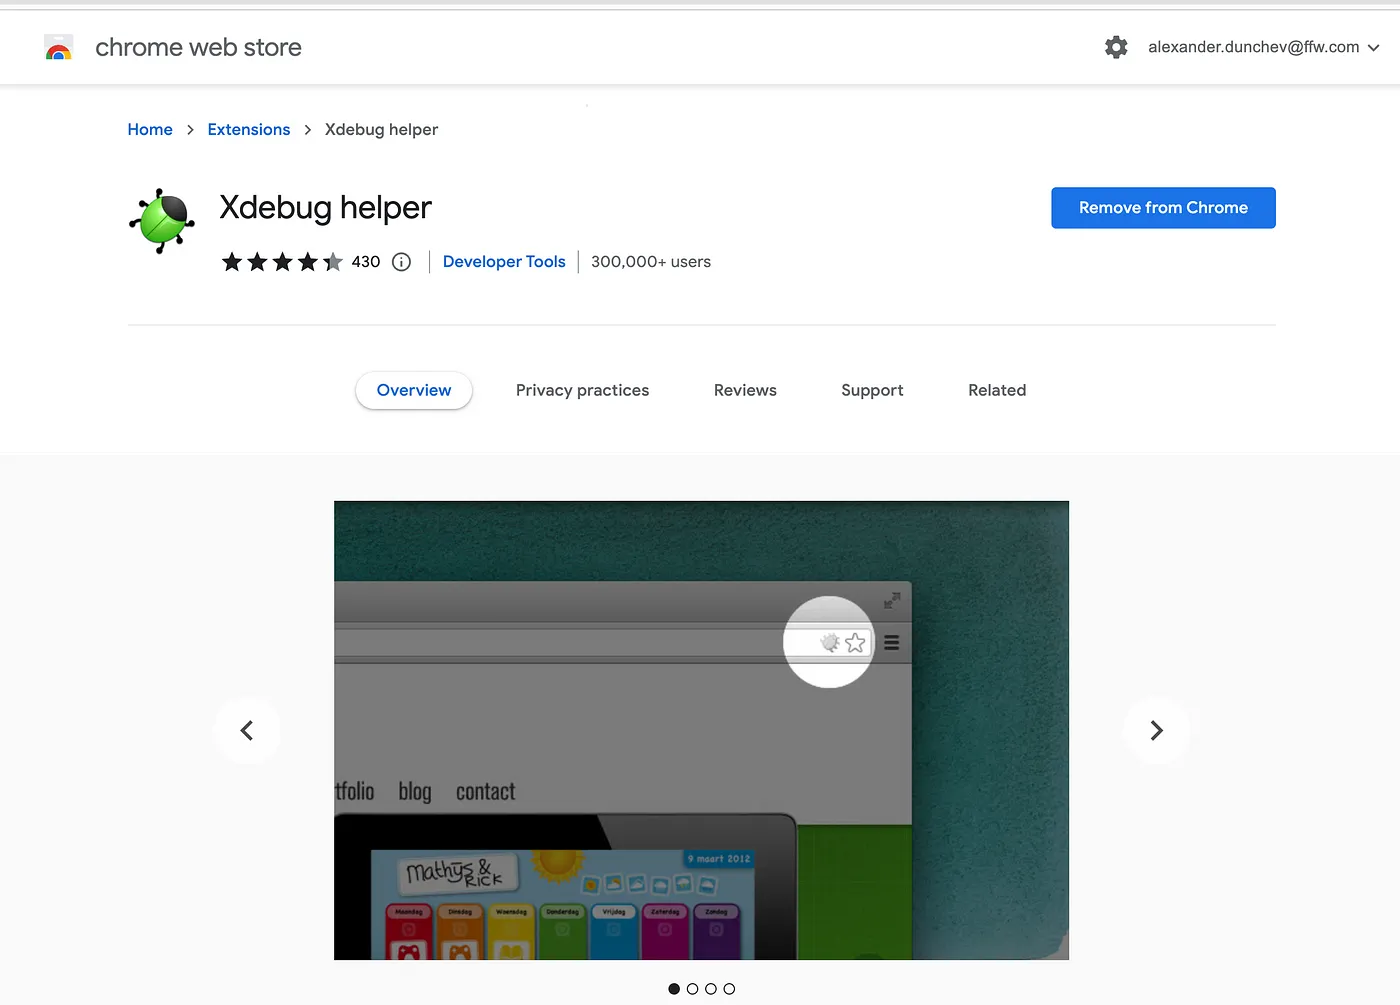
Then install the XDebug helper extension for Chrome: Xdebug helper
How to use the VSCode debugger
First, you need to start a debug session by clicking on the debug menu button:

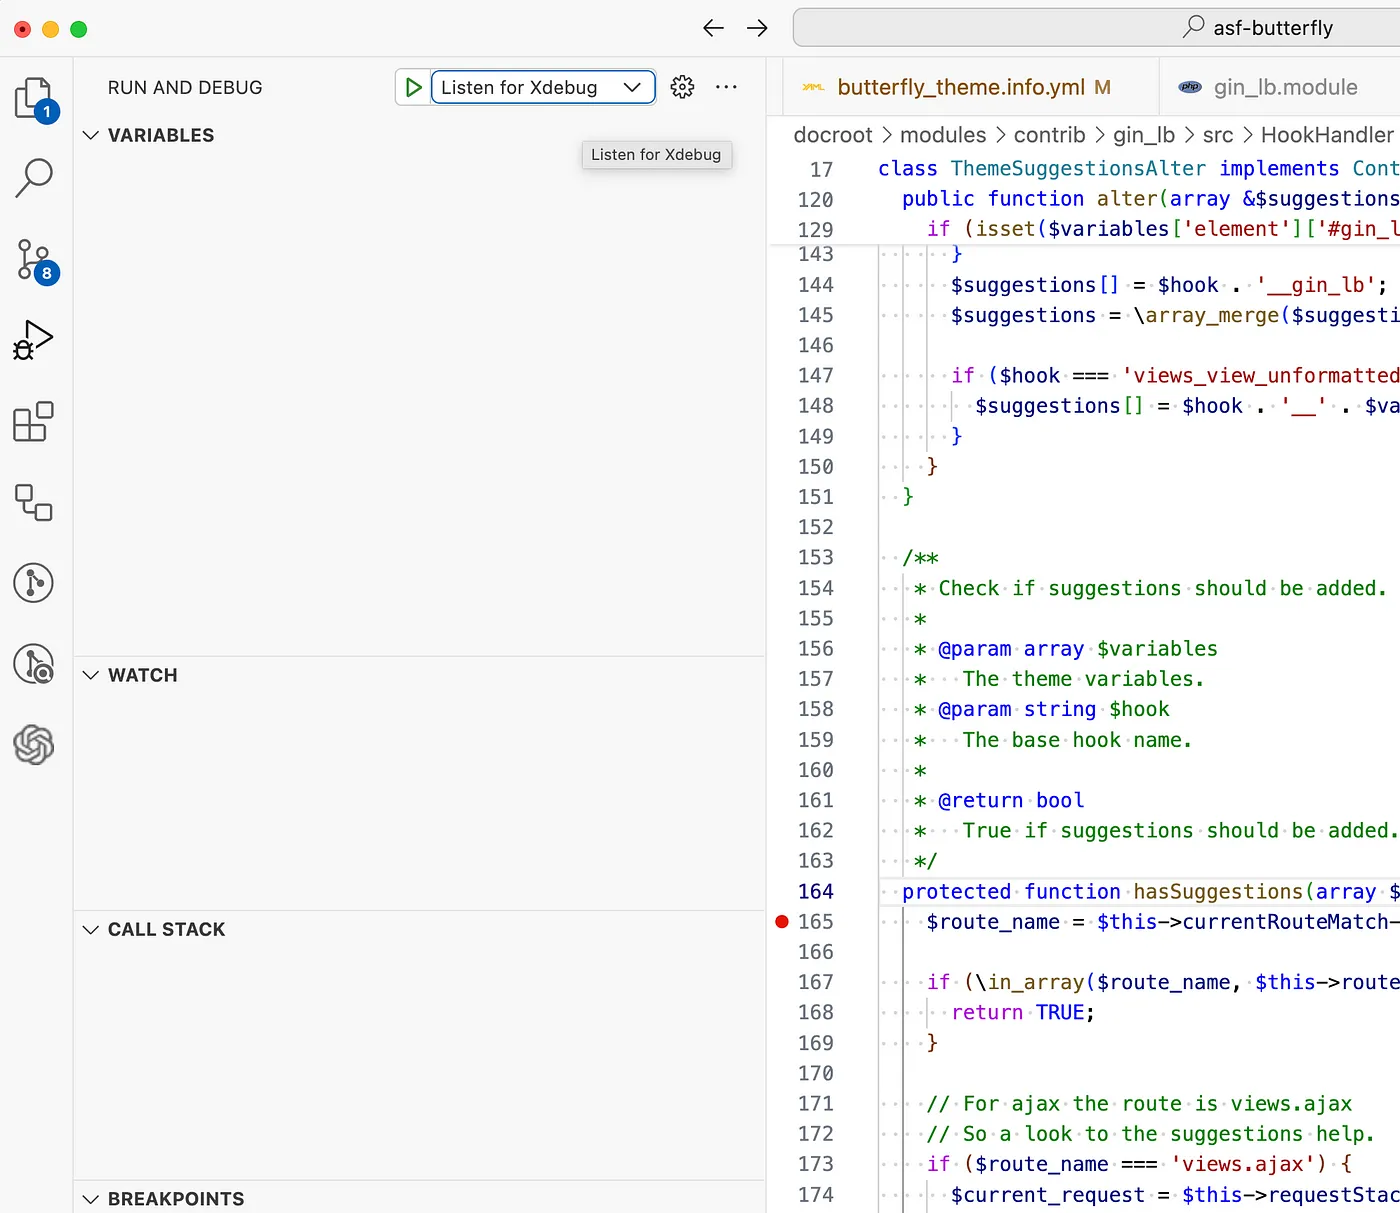
When you are in the debug tab in VSCode, in the drop-down, where the play button is, make sure you select listen for Xdebug:
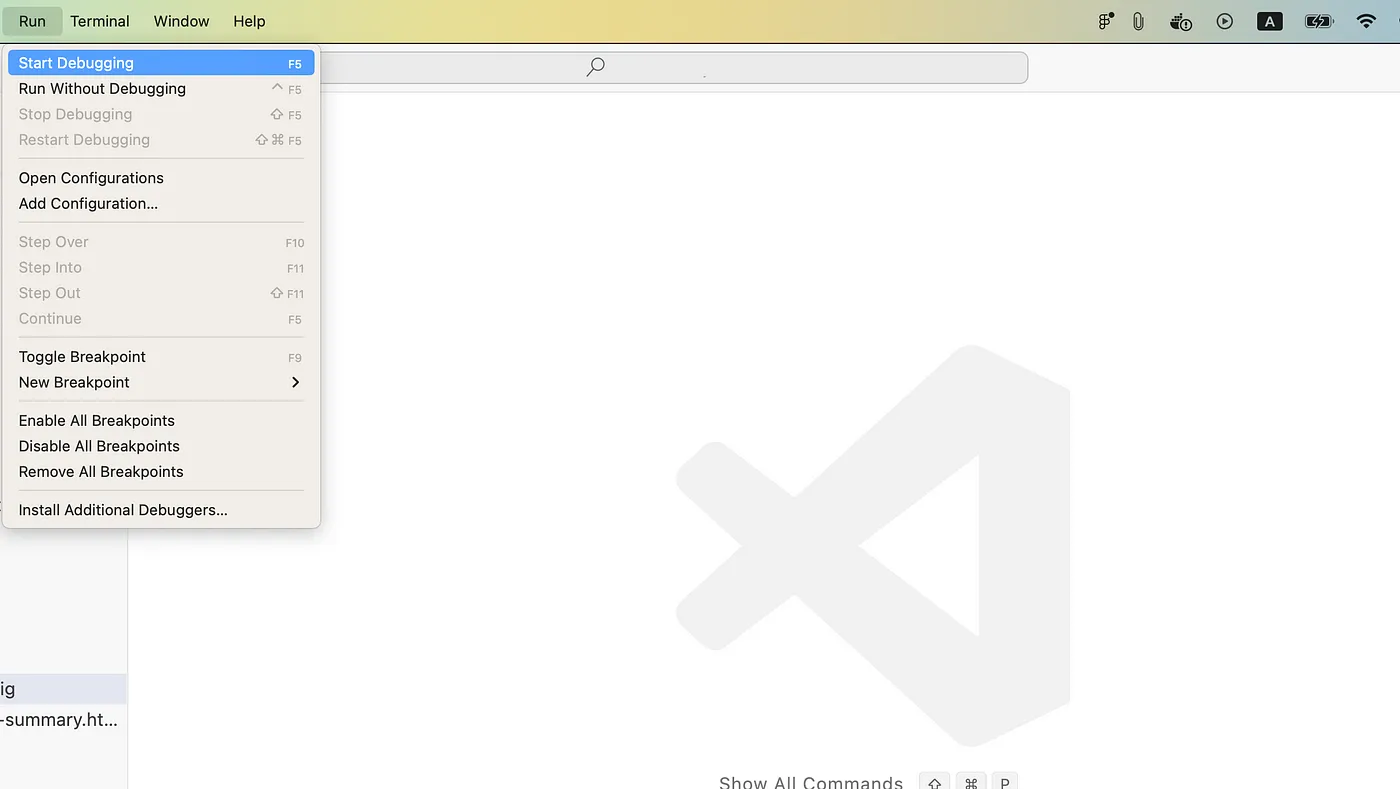
Or by selecting Run → Start debugging in the top menu:
Make sure XDebug is running in Lando by running: lando xdebug-on in the terminal.
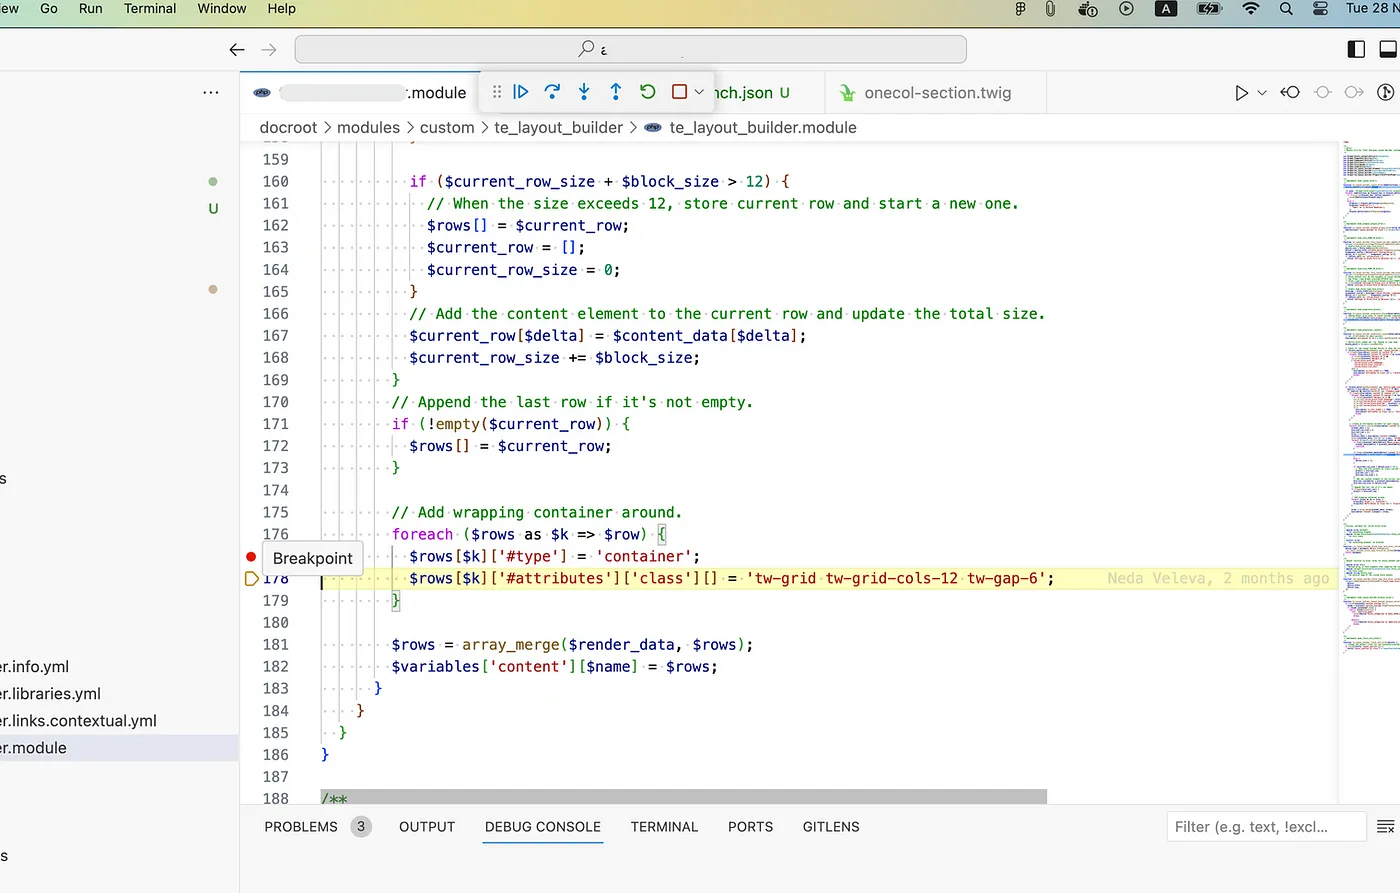
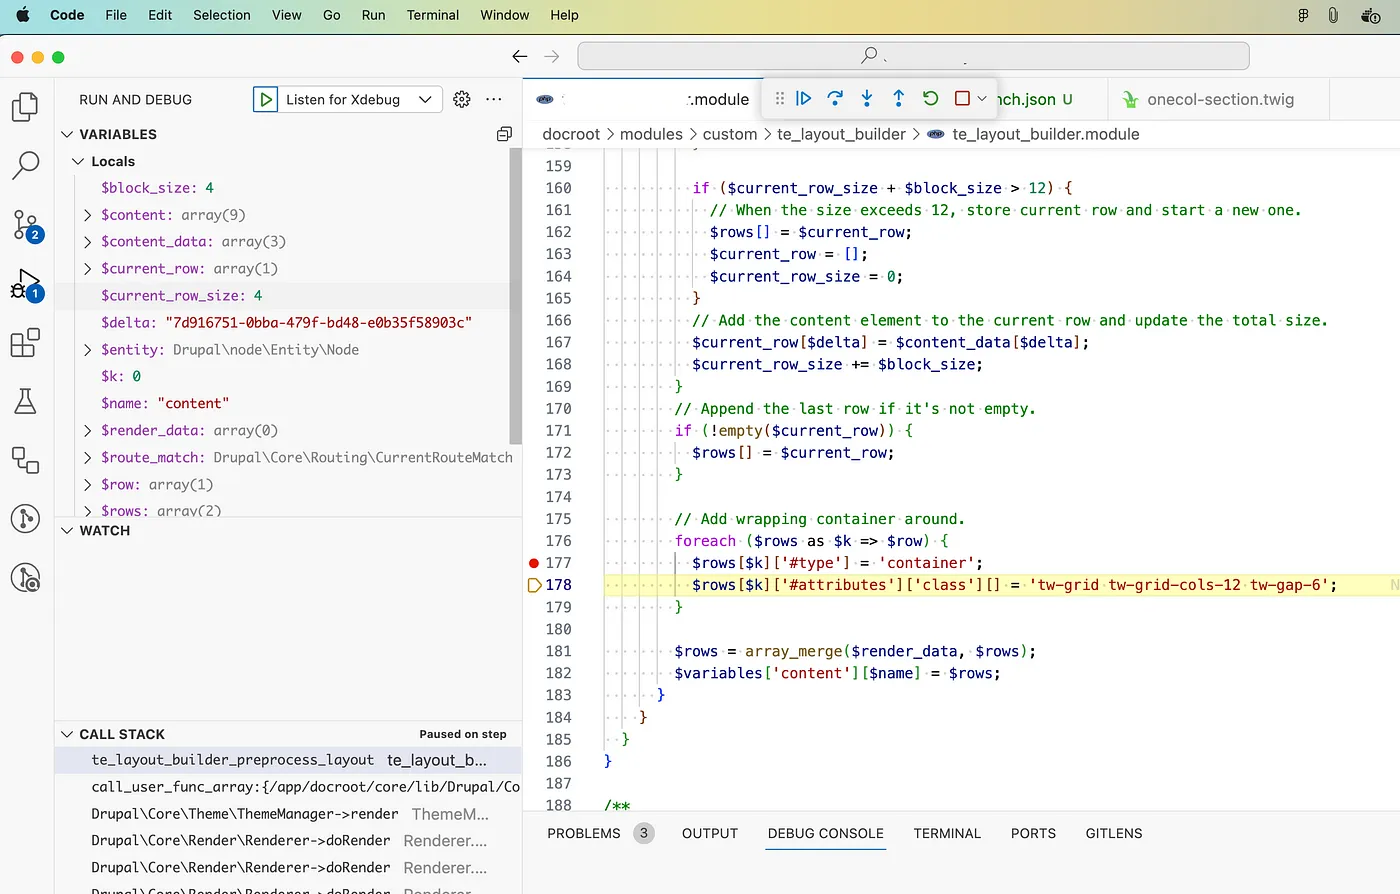
Put a breakpoint where you want your code to break execution:
Open your local site in Chrome browser and select the XDebug extension:
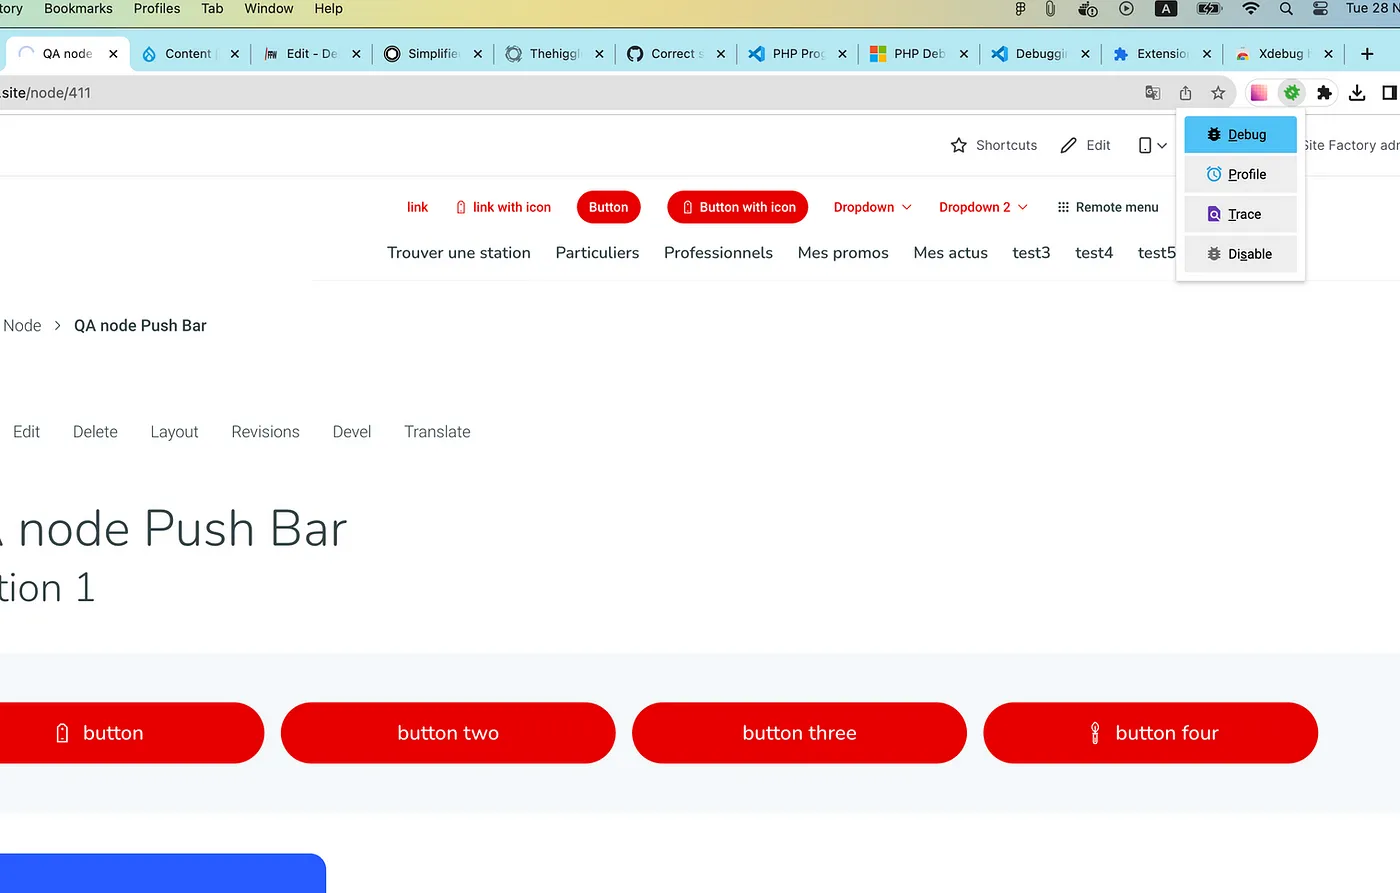
Refresh the page and VSCode should break on the breakpoint and you can inspect variables, go back and forth in the code…
Debug twig templates
Enable the devel module if you haven’t and simply put a
{{ devel_breakpoint() }}
in the template you want to debug. You will have to go through a few steps to reach the template with the breakpoint, but nothing major.
Here is the Drupal documentation about it: Debugging Twig templates.
This was it! Thanks a lot for reading ❤️